
Figure 5.
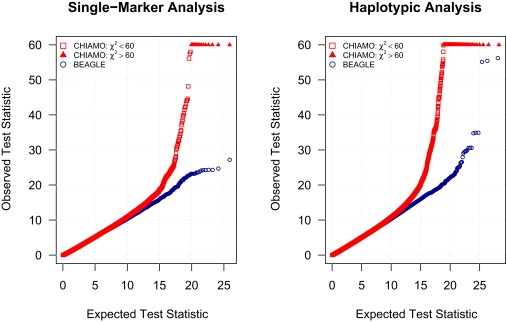
Quantile-Quantile Plots for Single-Marker and Haplotypic Analyses of Bipolar Disorder
Expected and observed association chi-square test statistics from analysis of CHIAMO genotype calls and BEAGLE genotype calls of WTCCC bipolar disorder and control data. An allelic test statistic and three genotypic test statistics, corresponding to dominant, overdominant, and recessive models, are computed for each marker (left panel) and each tested haplotype cluster (right panel).