
Figure 4.
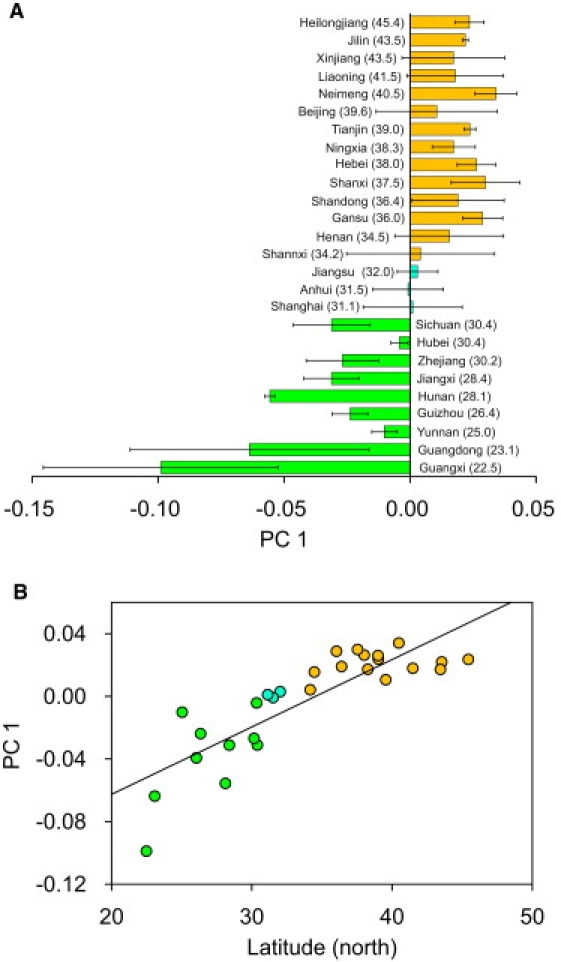
Relationship of PC1 and Latitude
(A) Average PC1 and latitude of populations. The standard deviation of PC1 is also shown for each population.
(B) Correlation of PC1 and latitude. The line in the plot shows the regression line (y = 0.0043x − 0.147). R2 for the linear regression of genetic distance on geographic distance is 0.69 (p = 1.27 × 10⁻⁷).