
Figure 4.
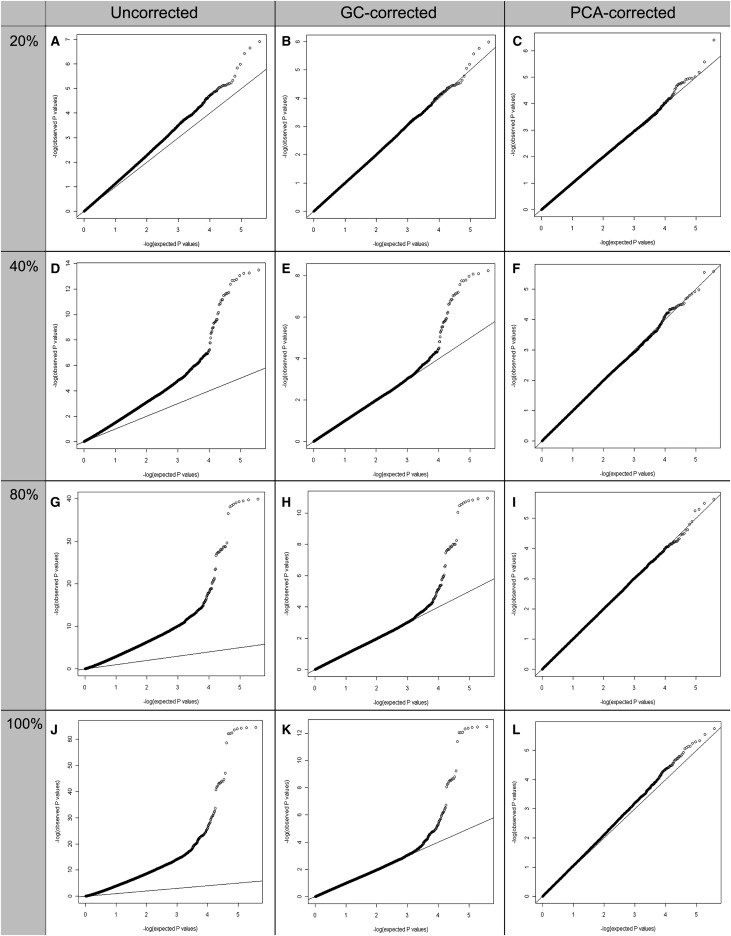
Q-Q Plots of the p Values from the Simulated Association Analyses with or without Correction for Population Stratification
The columns correspond to the Q-Q plots of the uncorrected, GC-corrected, and PCA-corrected p values. The rows correspond to 20%, 40%, 80%, and 100% stratification of the simulated case and control samples.
(A–C) 20% stratification: 500N cases, 400N and 100S controls.
(D–F) 40% stratification: 500N cases, 300N and 200S controls.
(G–I) 80% stratification: 500N cases, 100N and 400S controls.
(J–L) 100% stratification: 500N cases and 500S controls.