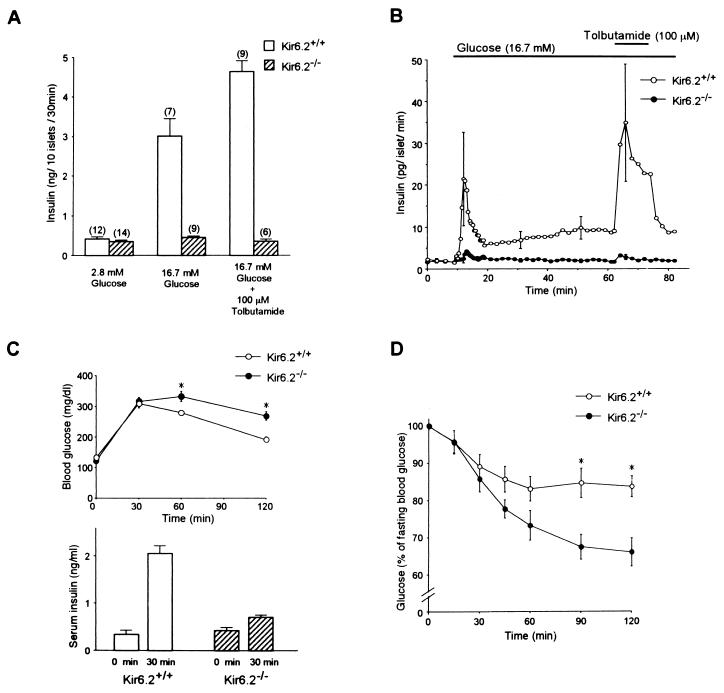
Figure 3.
(A) Insulin secretion in batch-incubated pancreatic islets of Kir6.2+/+ and Kir6.2−/−. There was no significant difference in the basal levels of insulin secretion in the presence of 2.8 mM glucose (Kir6.2+/+, 0.42 ± 0.05 ng/10 islets per 30 min; Kir6.2−/−, 0.35 ± 0.04 ng/10 islets per 30 min). In the islets of Kir6.2+/+, there was a 7.2-fold increase in insulin secretion in response to 16.7 mM glucose, and the secretion was further increased by addition of 100 μM tolbutamide. In contrast, in the islets of Kir6.2−/−, there was no increase in insulin secretion in response to 16.7 mM glucose, and addition of 100 μM tolbutamide did not elicit any insulin secretion. The number of experiments is indicated above each bar. (B) Insulin secretory responses to glucose and tolbutamide in perifused pancreatic islets of Kir6.2+/+ and Kir6.2−/−. There was no significant difference in the basal levels of insulin secretion in the presence of 2.8 mM glucose (Kir6.2+/+, 2.04 ± 0.50 pg/islet per min; Kir6.2−/−, 1.92 ± 0.41 pg/islet per min). Only a trace in the first phase of the insulin secretory response to 16.7 mM glucose was detected in Kir6.2−/−. There was no insulin response in the second phase in Kir6.2−/−. Tolbutamide (100 μM) in the presence of 16.7 mM glucose did not stimulate insulin secretion in Kir6.2−/−. For each experiment, pancreatic islets were isolated from three to five Kir6.2+/+ or Kir6.2−/−. The mean values ± SE were obtained from four and five independent experiments for Kir6.2+/+ and Kir6.2−/−, respectively. Horizontal bars indicate application periods of the agents. (C Upper) Intraperitoneal glucose tolerance test. Fasting blood glucose levels in Kir6.2+/+ and Kir6.2−/− were 132 ± 6 mg/dl (n = 11) and 121 ± 8 mg/dl (n = 11), respectively. The blood glucose levels of Kir6.2−/− 60 and 120 min after glucose load were slightly but significantly higher than those of Kir6.2+/+ (332 ± 16 mg/dl to 279 ± 8 mg/dl at 60 min) (n = 11) (268 ± 14 mg/dl to 192 ± 8 mg/dl at 120 min) (n = 11). ∗, P < 0.01. (C Lower) Insulin response to glucose load. The serum insulin concentrations before and 30 min after glucose load increased from 0.34 ± 0.09 to 2.05 ± 0.17 ng/ml in Kir6.2+/+ (n = 6, P < 0.001) and from 0.42 ± 0.07 to 0.70 ± 0.05 ng/ml in Kir6.2−/− (n = 6, P < 0.01). (D) Insulin tolerance test. The blood glucose levels of Kir6.2−/− (n = 10) 90 and 120 min after glucose load were significantly lower than those of Kir6.2+/+ (n = 10) (67.4 ± 3.4% to 84.7 ± 3.9% at 90 min; 66.0 ± 3.8% to 83.7 ± 2.8% at 120 min). ∗, P < 0.01.

