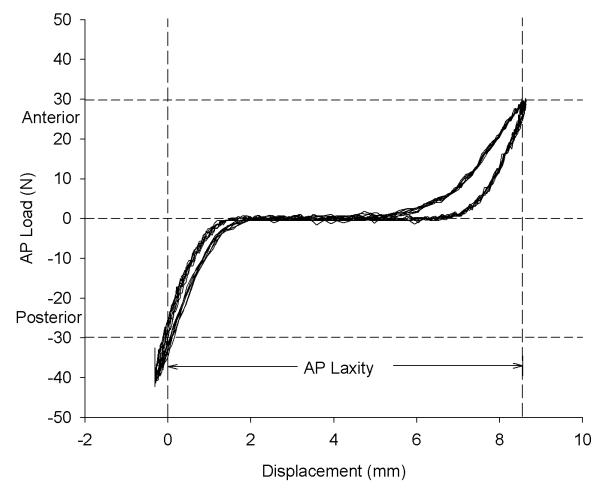
Fig. 2.
Sample graph of the AP laxity load versus displacement data. This test was for the sutures tied through both the anterior and middle tunnels (ANT-MID) with the knee flexed 30°. The resulting AP laxity for this specimen is 8.7 mm and represents the distance between ±30N on the anterior loading cycle of the curve. The selected load limits are sufficient since they are well within the linear portions of the anterior and posterior loading curves.

