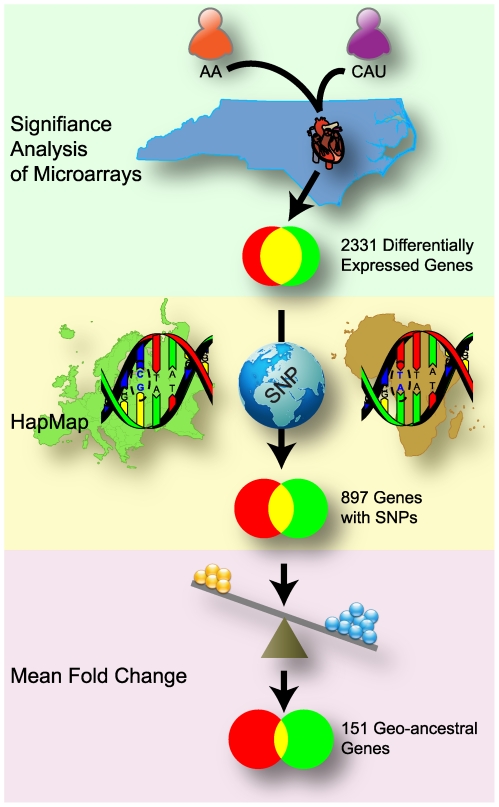
Figure 1. Workflow diagram to identify geo-ancestral genes.
The analysis used to identify geo-ancestral genes involved three primary steps: 1) Significance of Microarray (SAM) analysis of two distinct populations in North Carolina, Americans of African or European ancestry, identified 2531 genes as differentially expressed between the populations (green); 2) The set of 2531 genes was further restricted to those genes than had SNPs that distinguished to representative ancestral populations from the HapMap project, a total of 897 genes (yellow); 3) Further restriction to only those genes that have an absolute mean fold change of 1.3 yielded the set of 151 geo-ancestral genes (purple). SNP graphic courtesy of David Hall.

