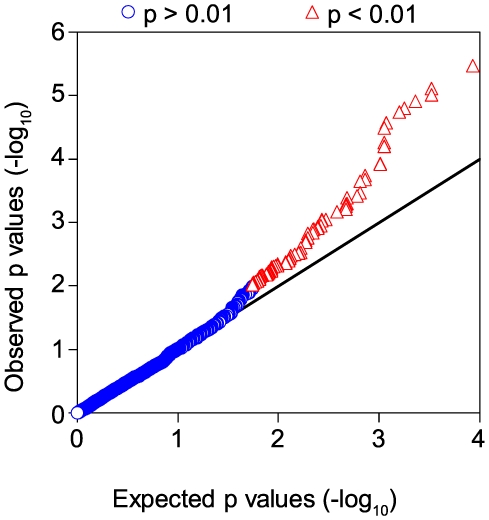
Figure 6. Increase in associations between SNPs and expression of the geo-ancestral genes.
The p value of the observed versus predicted eQTLs are plotted using the additive model of association. Data points above the line x = y (--) indicate p values that are smaller than expected due to chance after correcting for selection bias. There were 3241 SNPs found in the 151 geo-ancestral genes, 106 of which associated with expression at a p<0.01 (red) with the remainder at p≥0.01 (blue).

