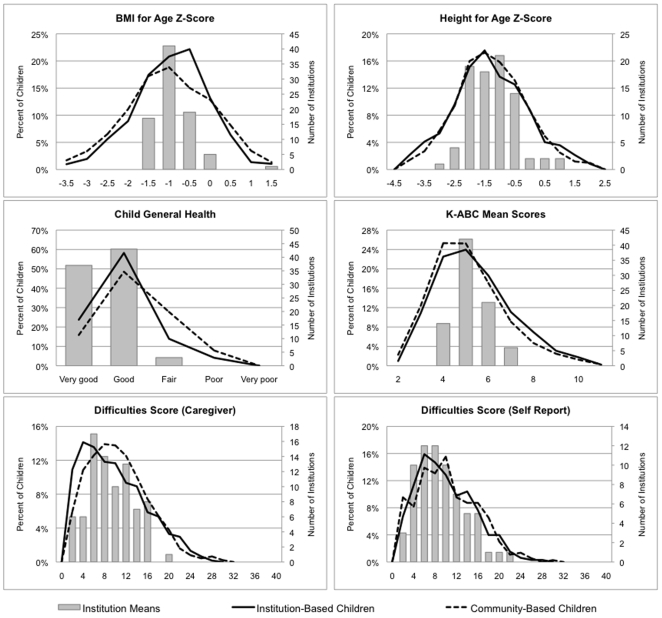
Figure 2. Distribution of child outcomes for community-based (N = 1,480) and institution-based (N = 1,357) children residing in 83 institutions.
Legend: Grey bars describe the distribution of institution means. Solid line describes the distribution of child outcomes among institution-based children. Dotted line describes the distribution of child outcomes among community-based children.

