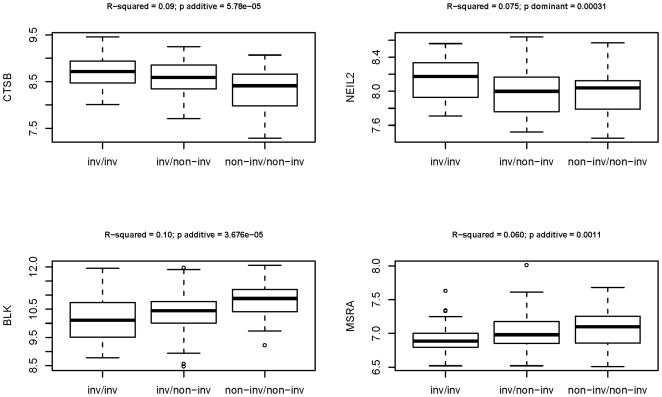
Figure 3. Box-plot representation for the differentially expressed CTSB, NEIL2, BLK and MSRA genes, according to the predicted inversion genotypes.
The underlying distributions of expression levels for each of the three possible inversion genotypes: homozygous inverted (inv/inv), heterozygous inverted (inv/non-inv) and homozygous non-inverted (non-inv/non-inv) are shown. On the top of each panel R-squared values derived from general linear model regressions and p-values under the most significant model of inheritance are represented.

