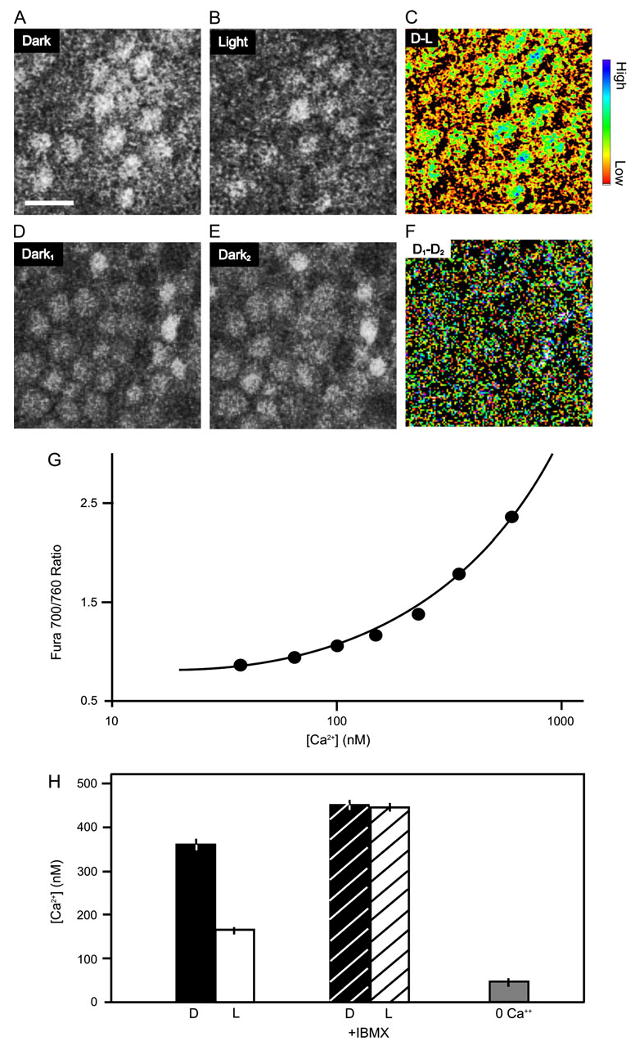
Fig. 1.

Light-elicited decrease in average Ca2+ in cone terminals. (A-D) Images from two-photon scans of OPL of a flat-mounted anole retina loaded with the Ca2+ dye OGB-1. To reveal the decrease in Ca2+ resulting from light, scans were taken from dark-adapted retina before (A) and after (B) 5-min illumination with white light. Pseudocolor difference image (scan in B − scan in A) highlights the drop in Ca2+ resulting from illumination (C) Scale bar in A is 10 μm. The blue end of the color scale represents a larger decrease in Ca2+; the red end of the scale represents a smaller decrease. To control for possible effects of scanning, control scans were taken before (D) and after (E) a continued period of 5 min in darkness. The difference image (scan in E − scan in D) shows no decrease in Ca2+ (F). Quantification of spatially averaged Ca2+ in cone terminals by two-photon imaging of fura-2. (G) The calibration curve was determined with a fura-2 calcium imaging calibration kit (Invitrogen) and fit with the standard equation (Grynkiewicz et al., 1985), yielding a best-fit Kd of 234 nM. For clarity, only the lower concentration portion of the sigmoidal calibration curve is shown (continuous line). (H) White light stimulation causes a 50% drop in internal Ca2+. Blocking rod and cone PDE with IBMX leads to a rise in Ca2+ above the dark level and eliminates the effect of light. Exposing the retina to Ca2+-free saline for 15 min causes Ca2+ to drop below the light level.
