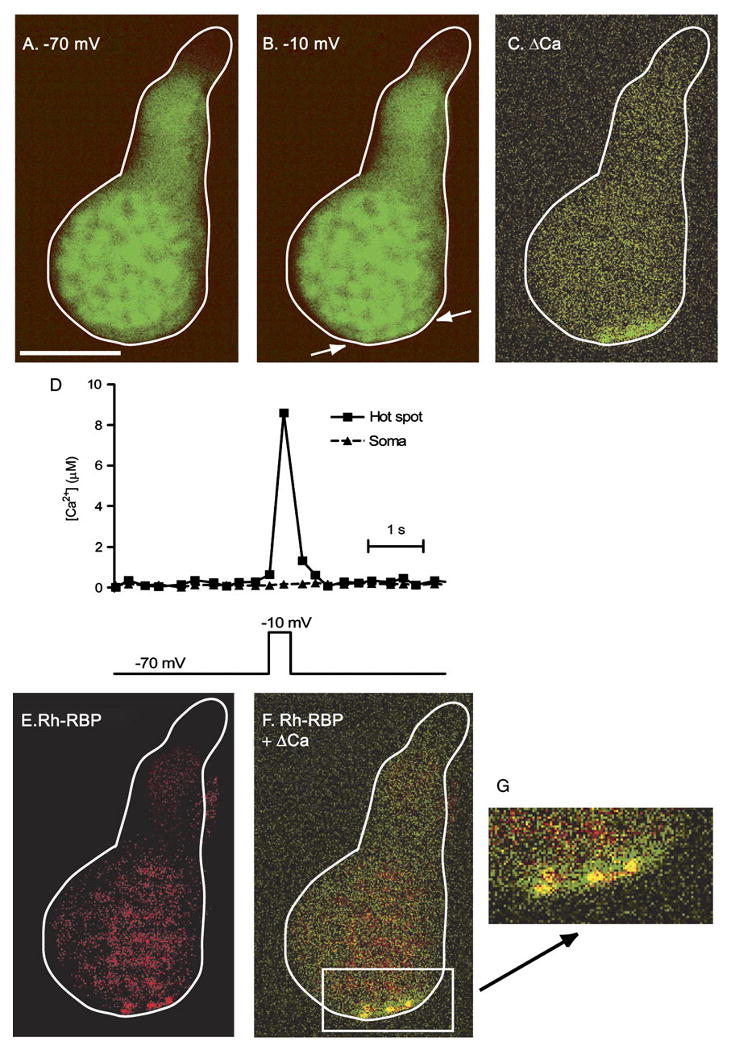
Fig. 3.

Ca2+ hot spots co-localize with synaptic ribbons. Cone loaded via a patch pipette with the low-affinity Ca2+ indicator dye OGB-6F and the ribbon-specific peptide, Rh-RBP. Fluorescent images were taken at −70 mV (A) and during depolarization to −10 mV (B). The voltage clamp stimulus and times at which images A and B were obtained are illustrated below the images. Difference image (C) shows regions at the base of the terminal exhibiting increased fluorescence (green pixels), indicating a higher Ca2+ concentration. Note the three Ca2+ “hot spots.” OGB-6F was imaged with 488-nm excitation and 525-nm emission filters. Duration of each frame during Ca2+ imaging was 48 ms. (D) The graph shows changes in Ca2+ within the hot spot and soma over time. ΔF/F was converted to [Ca2+] using eqn (1) and a Kd of 3 μM for OGB-6F. (E) Binding of Rh-RBP to synaptic ribbons in the same cone was visualized by exciting the dye with 568-nm excitation and 607-nm emission filters. Note the three spots of bright labeling (red pixels), presumably from three distinct synaptic ribbons. (F) Overlap of the change in OGB-6F fluorescence and Rh-RBP binding (yellow pixels), showing co-localization of Ca2+ hot spots and synaptic ribbons (panel C + panel E). (G) Magnification of the region containing Ca2+ hot spots. Scale bar =10 μm.
