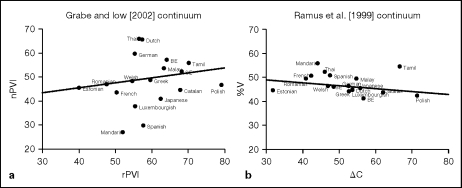
Fig. 2.
a Scatterplot and regression line for the rPVI and nPVI scores of the 18 languages tested by Grabe and Low [2002]. b Scatterplot and regression line for ΔC and %V scores of the same data. Based on the data of Grabe and Low [2002], produced with permission.

