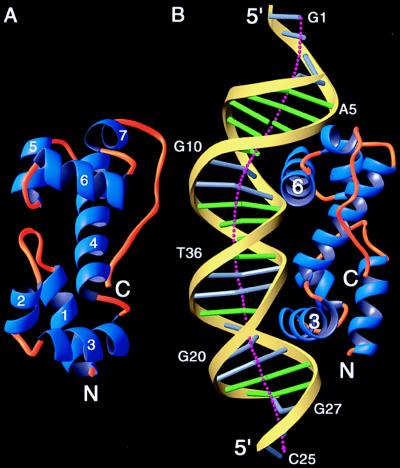
Figure 2.
The overall structure of MarA and its complex with DNA. (A) Ribbon diagram of MarA as seen from the DNA. Helix-1, -2, -3 and a part of helix-4 form the N subdomain and the remainder of the helices form the C subdomain. The two recognition helices, helix-3 and -6, which protrude above the plane, are not parallel but are tilted 30° relative to each other. The two subdomains are superimposable, with rms deviations of 1.6 Å for corresponding Cα atoms (33). (B) A ribbon diagram of the MarA–DNA complex showing the insertion of the recognition helices into the adjacent DNA major grooves and the overall bending of DNA. This orientation is obtained by a rotation of ≈90° along the DNA helical axis in the view of A. The N subdomain is bound to the downstream sequences of the binding site in the mar promoter and positioned closer to the transcription start site, whereas the C subdomain is bound to the upstream sequence. Different color codes are used for the DNA: yellow ribbon for the sugar-phosphate backbone, green cylinder for the A–T base pairs, and silver cylinder for the G–C base pairs. The dotted line shows the overall DNA helical axis calculated by the curves program (22). Clearly, both ends are curved more than the central part of DNA (bases 10–20). These figures were prepared by using the ribbons program (34).

