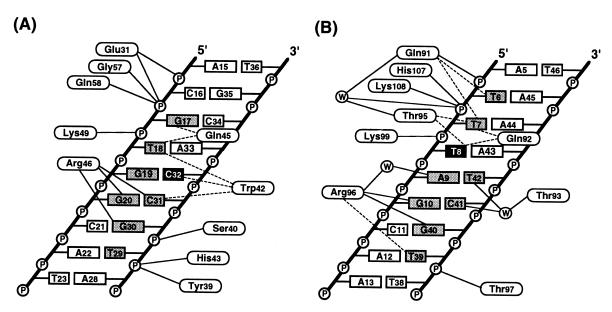
Figure 4.
A schematic representation of MarA interactions with DNA. The interactions are for the N subdomain (A) and the C subdomain (B) of MarA. Dashed and solid lines correspond respectively to van der Waals interactions (interatomic distance <4.0 Å) between the nonpolar atoms and hydrogen bonds (interatomic distance <3.5 Å) between the polar atoms. Water molecules are observed only in the C subdomain and are enclosed in circles. The bases buried by the binding of MarA are shaded in gray and two bases, C32 and T8, that may have roles in the sequence specificity are in black (see text for more details). Except for Gly-57, Gln-58, His-107, and Lys-108, all of the other indicated residues use their side chains to make hydrogen bonds to the phosphate backbone groups and the bases. The average interatomic distance for hydrogen bonds is ≈2.9 Å. Although the side chain of Lys-99 is 3.7 Å distant from the phosphate group, Lys-99 was considered as a hydrogen bond donor due to its relatively blurred electron density at the ɛ-amino group. Other possible hydrogen bonds between Gln-92 and the O4 of T7 and between Trp-42 and the N4 of C32 are not shown here due to relatively long interatomic distances of 3.5 Å.

