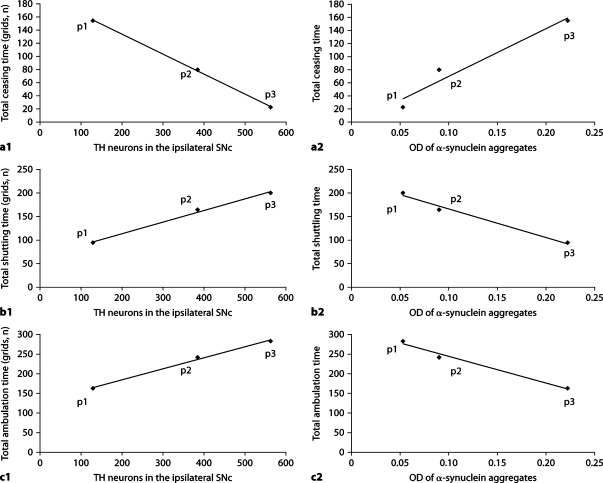
Fig. 9.
Correlation between behavioral changes and histopathologic changes in lactacystin-treated animals. p1, p2 and p3 = Up to 7, 14 and 21 days after lactacystin administration, respectively. a1 Correlation between TH neuron counts (x-axis) and total ceasing time (y-axis) in lactacystin-treated animals (r = −0.721, p = 0.106). a2 Correlation between the OD of α-synuclein aggregates (x-axis) and total ceasing time (y-axis) in lactacystin-treated animals (r = 0.878, p = 0.021). b1 Correlation between TH neuron counts (x-axis) and total shuttling time (y-axis) in lactacystintreated animals (r = −0.624, p = 0.186). b2 Correlation between the OD of α-synuclein aggregates (x-axis) and total shuttling time (y-axis) in lactacystin-treated animals (r = 0.926, p = 0.008). c1 Correlation between TH neuron counts (x-axis) and total ambulation time (y-axis) in lactacystin-treated animals (r = 0.446, p = 0.375). c2 Correlation between the OD of α-synuclein aggregates (x-axis) and total ambulation time (y-axis) in lactacystintreated animals (r = −0.956, p = 0.003).
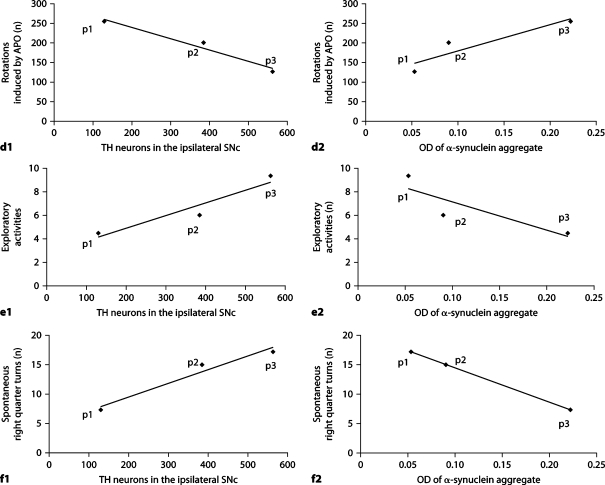
d1 Correlation between TH neuron counts (x-axis) and the number of rotations following unilateral administration of APO (y-axis) in lactacystin-treated animals (r = −0.534, p = 0.275). d2 Correlation between the OD of α-synuclein aggregates (x-axis) and the number of rotations following unilateral administration of APO (y-axis) in lactacystin-treated animals (r = 0.993, p = 0.007). e1 Correlation between TH neuron counts (x-axis) and number of exploratory activities (y-axis) in lactacystin-treated animals (r = 0.814, p = 0.049). e2 Correlation between the OD of α-synuclein aggregates (x-axis) and the number of exploratory activities (y-axis) in lactacystin-treated animals (r = −0.915, p = 0.01). f1 Correlation between TH neuron counts (x-axis) and the number of spontaneous right quarter turns (y-axis) in lactacystintreated animals (r = 0.809, p = 0.051). f2 Correlation between OD of α-synuclein aggregates (x-axis) and the number of spontaneous right quarter turns (y-axis) in lactacystin-treated animals (r = −0.909, p = 0.012).


