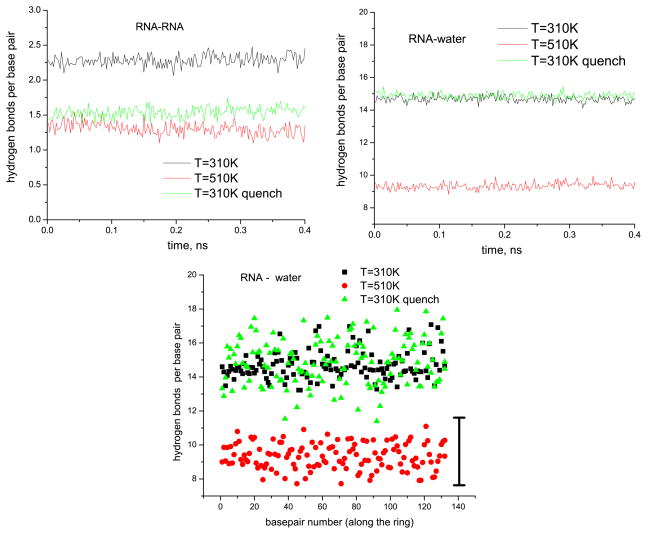
Figure 8.
Hydrogen bonds in the RNA nanoring system. Top: typical time dependences of total number of hydrogen bonds for RNA–RNA and RNA–water interactions (data are given per base pair) during the last 400 ps long chunks of the simulated trajectories. Bottom: time-averaged number of hydrogen bonds (RNA–water) for every base pair versus base pair number (along the ring). The vertical black bar shows typical dispersion for this number in a trajectory.

