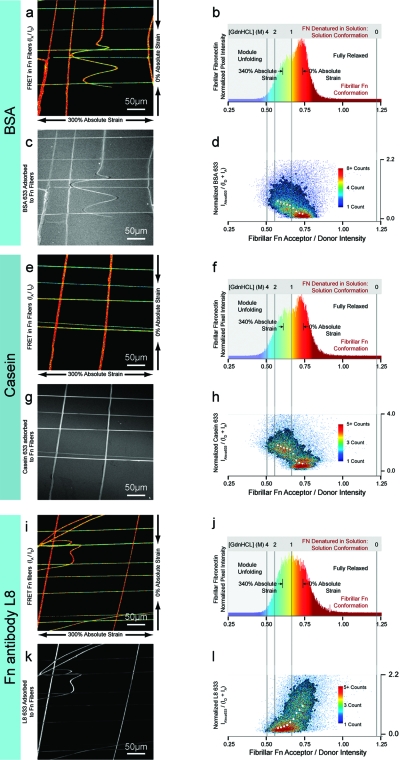
Figure 1.
Colocalization analysis of albumin, casein, and the Fn antibody L8 (FnI9-FnIII1) to fibrillar Fn stretched in a uniaxial strain device. (a) FRET IA/ID values in false color for Fn fibers that have incorporated 5% of Fn-DA. (b) Corresponding histogram with calibration lines indicating the IA/ID ratios of soluble Fn denatured by GdnHCl in solution. (c) Fluorescence intensity of BSA labeled with Alexa Fluor 633 (BSA-633) adsorbed to Fn fibers. Absolute fiber strains shown were defined as 100(L-Lo)/Lo, where L is the extended fiber length and Lo is the fiber length when fully relaxed. (d) The corresponding plot giving the BSA-633 intensity normalized per labeled Fn. The color bar represents the number of pixels with a given IA/ID ratio of fibrillar Fn and BSA intensity. The medians are given as white dots. Panels (e−h) and (i−l) show the same data anlysis displayed for casein and Fn antibody L8, respectively. Data averages obtained from 10 fields of views for albumin, casein and for all proteins in whole bovine serum are shown in the Supplements (Figure S4). (Please note that our FRET ratios were not corrected for minute crosstalk between the excitation and emission channels, since absolute distances were not calculated here.)

