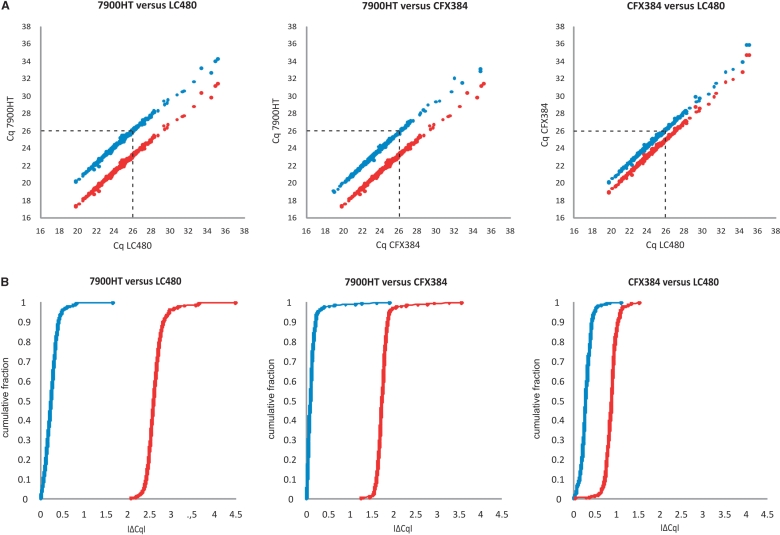
Figure 1.
(a) Correlation plots of the Cq values from 366 samples for a representative target gene (ARHGEF7) measured on two different qPCR platforms before (red) and after (blue) Cq level IRC using a five-point serial dilution series of external standards run in parallel with the patient samples. (b) Cumulative distribution plots of the difference in Cq for a representative target gene (ARHGEF7) and 366 samples measured on two different qPCR platforms before (red) and after (blue) Cq level IRC. Each dot represents a patient sample. The vertical (a) and horizontal (b) distance between two correlation scatterplots (a) or distribution plots (b) designates the platform dependent difference in Cq value between both platforms.

