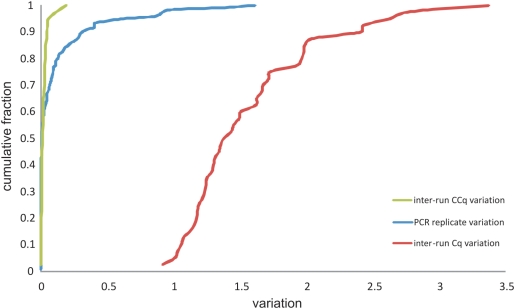
Figure 2.
Cumulative distribution plots depicting the intra-run variation between the PCR replicates for the standard samples as well as the inter-run variation between IRC samples before and after IRC. Results are based on data from all tested genes (ARHGEF7, HIVEP2, HPRT1, MRPL3, NRCAM, SDHA, TNFRSF25 and UBC) on three different qPCR platforms (Cq, quantification cycle value; CCq, calibrated Cq value).

