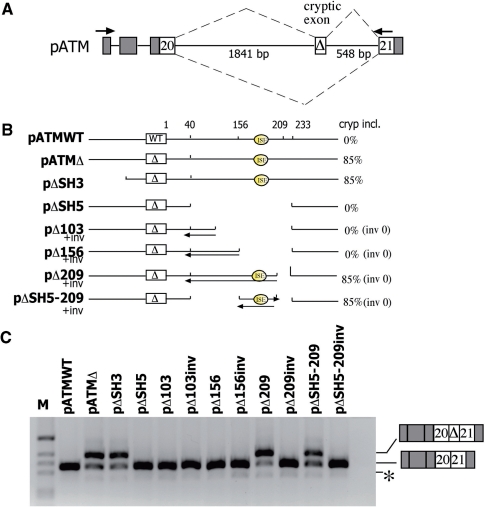
Figure 1.
ATM intron 20 contains sequences that enhance the cryptic exon activation. (A) Schematic representation of the pATM minigene. α-globin and ATM exons are grey and white boxes, respectively, and introns are lines. The cryptic 65 bp ATM exon activated by the GTAA deletion (Δ) is indicated. Splicing pattern is represented with diagonal dashed lines and the arrows indicate location of E16 and 2550 primers used in RT–PCR analysis. (B) Diagram indicating deletions introduced within the intron 20 of the pATM minigenes. The nucleotide distance downstream of the cryptic exon and of the Intronic Splicing Enhancer (ISE) are indicated. On the right it is indicated the percentage of cryptic exon inclusion as deduced form panel C and expressed as mean of three independent experiments done in duplicate. inv refers to sequences inserted in inverted orientation. (C) Splicing assay. The ATM minigenes were transfected in HeLa cells and the pattern of splicing was analyzed with the indicated primers. RT–PCR fragments were resolved on 2% agarose gel. M is the molecular weight marker 1 kb. The cryptic exon inclusion and exclusion forms are indicated and the asterisk corresponds to a minor product in which the hybrid exon made of globin exon 3 and ATM exon 20 is skipped.

