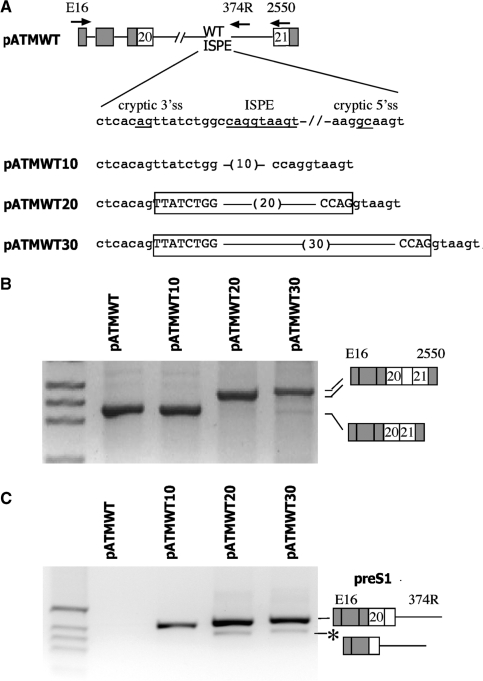
Figure 3.
Effect of the distance between the cryptic 3′ss and the ISPE on the splicing pattern. (A) A schematic representation of the pATMWT minigenes. α-globin and ATM exons are grey and white boxes, respectively, and introns are lines. A sequence of 10, 20 and 30 nucleotides (in brackets) was inserted between the cryptic 3′ss and the ISPE (both underlined). The exonic sequences activated by the spacer insertions are boxed and the introns are indicated in lower letters. The arrows indicate location of the primers used in RT–PCR analysis. (B) To analyze the mature transcript the hybrid minigenes were transfected in HeLa cells and analyzed with E16 and 2550 primers. RT–PCR results of the transfection experiments were resolved on 2% agarose gel; the resulting bands were analyzed by direct sequencing and their identity is schematically represented. M is the molecular weight marker 1 kb. (C) To analyze the preS1 transcript the hybrid minigenes were transfected in HeLa cells and analyzed with E16 and 374R primers. RT–PCR results of the transfection experiments were run on 2% agarose gel and the resulting bands were analyzed by direct sequencing. M is the molecular weight marker 1 kb. The asterisk corresponds to a minor spliced product without the hybrid exon made of globin exon 3 and ATM exon 20.

