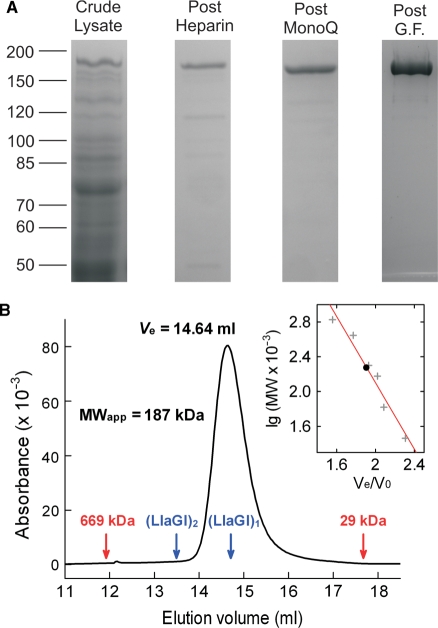
Figure 2.
Purification and solution stoichiometry of LlaGI. (A) Lanes from separate SDS polyacrylamide gels showing stages in the protein purification protocol. G.F., gel filtration. The Post G.F. lane represents 5 µg of purified RM.LlaGI. See ‘Materials and Methods’ section for full details. (B) Elution profile of 263 µg (14.7 µM) LlaGI from a 24 ml Superose 6 column. 100 µl of protein sample was eluted in TMD Buffer plus 15 mM NaCl at 0.4 ml/min. Protein was monitored using absorbance at 280 nm. The elution volumes of the thyroglobulin (669 kDa) and carbonic anhydrase (29 kDa) standards are indicated in red. Indicated in blue are the putative elution volumes of a LlaGI monomer and dimer assuming a theoretical MW of 179 kDa (calculated from the full length amino acid sequence). (Inset) The apparent molecular weight of LlaGI was evaluated from the elution volume using a series of standards (‘Materials and Methods’ section). The red line indicates a least squares linear fit.

