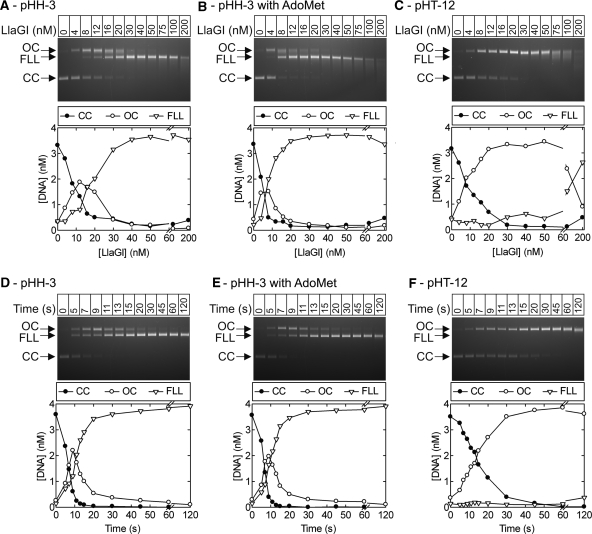
Figure 6.
Stoichiometry and rate of DNA cleavage by LlaGI. Points are the mean of at least two repeat experiments. Note that where the FLL product becomes smeared due to end-processing, this can cause an overestimation of the CC band which overlaps with the smear. Similarly, smearing of the OC intermediate in part C causes the CC and FLL bands to be overestimated. This smearing most likely results from processing of the nicked DNA to form ssDNA gaps of different lengths (e.g. by exonucleolytic digestion from the nick). (A) pHH-3 (Figure 3) was incubated with LlaGI at the concentrations indicated for 1 hr. (B) As (A) except in the presence of 100 µM AdoMet. (C) pHT-12 (Figure 3) was incubated with LlaGI at the concentrations indicated for 1 h. (D) Time course of cleavage of pHH-3 with a saturating concentration of LlaGI (200 nM). (E) as (D) except in the presence of 100 µM AdoMet. (F) Time course of cleavage of pHT-12 with a saturating concentration of LlaGI (200 nM). Gels labelled as in Figure 3.

