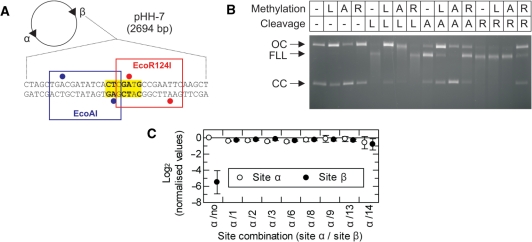
Figure 7.
Methylation specificity of LlaGI. (A) Plasmid pHH-7 (Figure 3) showing the overlapping EcoAI (blue), LlaGI (bold and yellow) and EcoR124I (red) sequences at Site β. Adenine residues methylated by EcoAI and EcoR124I are indicated by blue and red circles, respectively (2). (B) pHH-7 was treated with LlaGIDA078 (L), M.EcoAI (A) or M.EcoR124I (R), as indicated, in the presence of AdoMet. These DNA substrates were then treated with LlaGI (L), EcoAI (A) or EcoR124I (R), as indicated, in the presence of ATP and AdoMet. The DNA was then separated by agarose gel electrophoresis. See ‘Materials and Methods’ section and main text for full details. Note, cleavage by all three enzymes produces linear DNA that is further processed to generate a DNA smear. (C) pZero, pOne and pHH−1, −2, −3, −6, −8, −9, −13 and −14 (Figure 3) were incubated with LlaGIDA078 and [3H-methyl] AdoMet for 1 h. The extent of 3H-labelling of each site was then assessed by scintillation counting (‘Materials and Methods’ section). For each plasmid, the labelling at each site was corrected for the gel background and the background from the corresponding fragments of pZero. Values were then normalised relative to Site α of pOne. These values are presented as a linear scale where positive values indicate increased labelling relative to Site α and negative values indicate reduced labelling relative to Site α. In pOne the region of Site β is random DNA and therefore acts as a non-specific control. The value of this should tend towards an infinitely small negative value. The observed value of ∼−6 therefore suggests a small background labelling of non-specific sites when a specific site is present on the DNA (i.e. the background labelling is higher than on pZero). In each plasmid the sequence at Site α is the same. Therefore, the values should all be zero, as in plasmid pOne. Given that the values for Sites α and β were very similar on each DNA, small variations between plasmids most likely represent different efficiencies of methylation that arise from variations in DNA preparation quality. Error bars represent the standard error from three repeat experiments.

