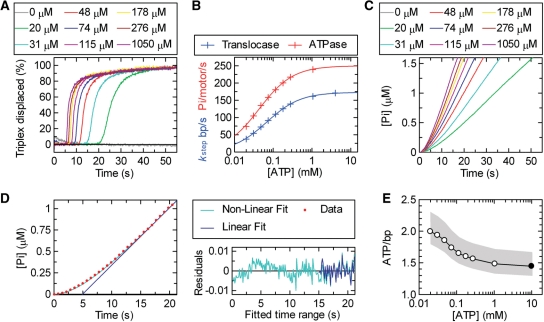
Figure 3.
The coupling of ATP hydrolysis to DNA translocation. (A) Translocation profiles measured using triplex displacement at different ATP concentrations as indicated using 1 nM RMA03F (0.5 nM 807 bp triplex) and 10 nM LlaGI. By using data collected at each ATP concentration for each of the triplex spacings, kstep was calculated as in Figure 2E (data not shown). (B) The relationship between kstep (blue) and kATP (red) as a function of ATP concentration. The solid lines represent least-squares fits to Equation (3). (C) Steady-state phosphate release measured using the PBP assay (‘Materials and Methods’ section); 0.5 nM RMA03F was pre-incubated with 10 nM LlaGI and the reaction initiated with ATP at the concentrations indicated. Profiles have been corrected for a non-specific background measured on RMA03 (data not shown). (D) Example of the fits used to estimate the ATPase rate (V) from the phosphate release data. For clarity, a reduced number of data points (red circles) are shown for the 48 µM profile from (C). Fitting was carried out using the complete data set. The data was fitted to both Equation (4) (green line) and Equation (5) (blue line). The residuals for each fit are shown. There are systematic non-random variations from Equation (4) during the initiation phase, whilst both equations return the same linear fit beyond 15 s (see text for more details). kATP was calculated from the linear steady-state rate (V) assuming one active motor per DNA molecule. (E) The coupling of ATP to translocation. The measured and fitted values for kATP were divided by the corresponding kstep values to give the apparent number of ATP molecules hydrolysed per base pair translocated as a function of ATP concentration. The filled circle indicates the value calculated using the Vmax values from (B). The grey shading indicates the extent of the estimated error range (‘Materials and Methods’ section).

