FIGURE 1.
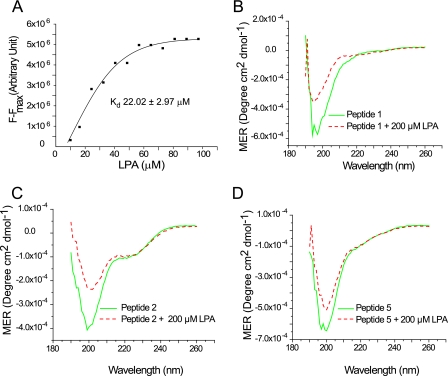
Direct interaction of villin with LPA. A, kinetic analysis of villin fluorescence titration data. Binding curve plotting (F − Fmax) versus LPA was used to calculate the apparent dissociation constant (Kd) of villin and LPA as 22.02 ± 2.97 μm. This experiment is representative of three with similar results. Circular dichroism spectra of villin peptides, peptide 1 (B), peptide 2 (C), and peptide 5 (D) were recorded in the absence or presence of LPA (200 μm). This experiment is representative of three with similar results.

