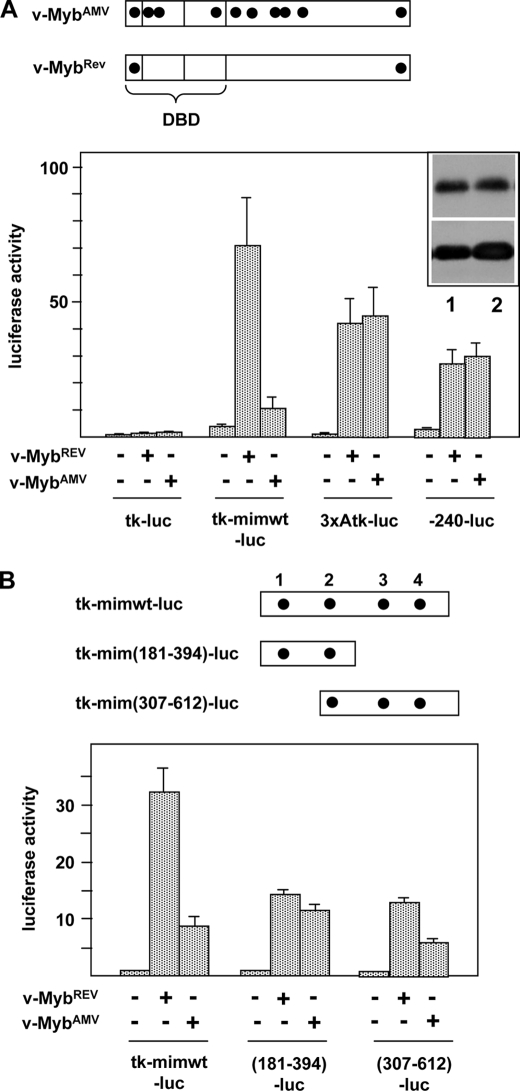
FIGURE 1.
Activity of v-MybAMV and v-MybREV at the mim-1 enhancer. A, top, schematic illustration of the structure of v-MybAMV and v-MybREV. Black dots mark point mutations relative to c-Myb. DBD, DNA binding domain. Bottom, HD11 cells were transfected with the indicated luciferase reporter genes and expression vectors for v-MybAMV, v-MybREV, or empty expression vector. 24 h after transfection, the cells were analyzed for luciferase and β-galactosidase activity. The columns show the average luciferase activity normalized against the activity of the cotransfected β-galactosidase plasmid. Thin lines show S.D. The upper part of the inset at the top right corner shows a Western blot of v-MybREV (lane 1) and v-MybAMV (lane 2) of the transfected cells and β-actin as loading control. B, top, schematic illustration of truncated enhancer constructs. Numbers refer to Chayka et al. (24). Myb binding sites are marked by black dots. Bottom, luciferase reporter genes containing the full-length or truncated mim-1 enhancer upstream of the tk promoter were transfected and analyzed as in A.

