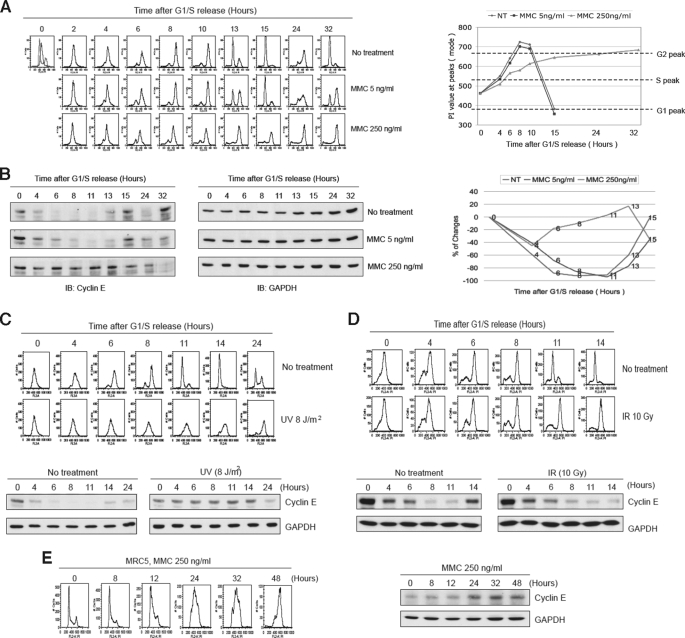
FIGURE 1.
Cyclin E is stabilized in response to replication fork barriers. A, cell cycle analysis of HeLa cells synchronized by a double-thymidine block and released into MMC. FACS analysis (left panel) and quantitation of PI staining (right panel) are shown. The highest value for the largest peak (mode) is represented. B, immunoblots showing cyclin E levels in cells presented in A. Glyceraldehyde-3-phosphate dehydrogenase (GAPDH) is a loading control. Far right panel shows quantitation of cyclin E bands. C and D, similar experiment as shown in A except that cells were treated with UV or IR and subsequently released into normal medium. Upper panels show FACS analysis, and lower panels show immunoblots. E, unsynchronized MRC5 primary human fibroblast cells were exposed to MMC and analyzed by FACS (left panel) and immunoblotting (right panel).

