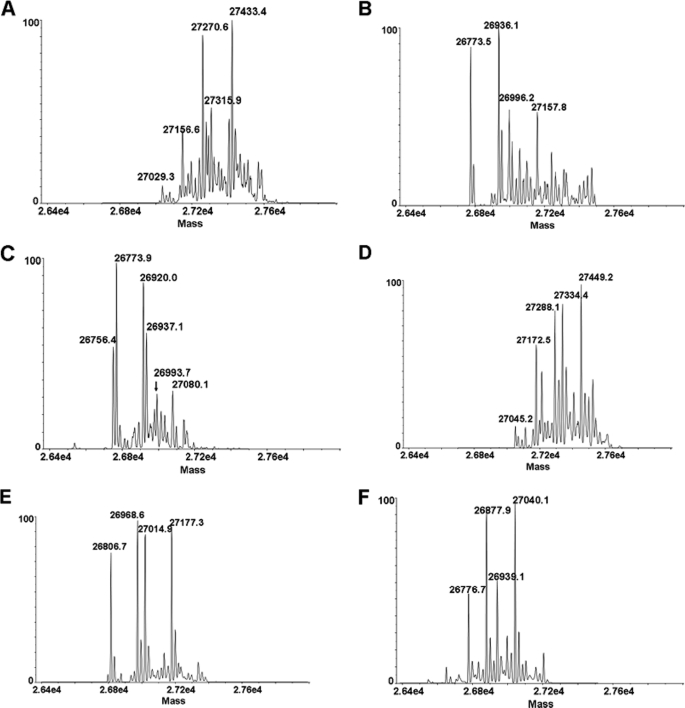
FIGURE 3.
RP-HPLC-TOF/MS analysis of the Fc-HC fragments. The deconvoluted mass spectra of peaks 1–3 from P1 are presented in A–C. The deconvoluted mass spectra of peaks 1–3 from C1 are presented in D–F. Each major peak is labeled with its mass, and the corresponding fragments, including modifications proposed by the mass analysis, are summarized in Table 1.

