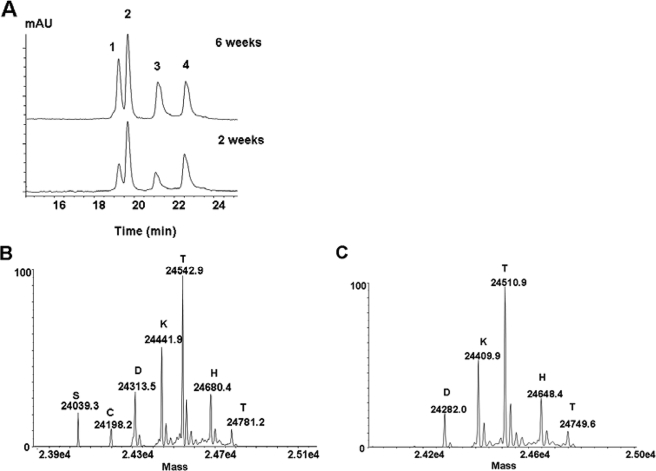
FIGURE 4.
RP-HPLC-TOF/MS analysis of the C2 fragment. A, UV profile of the purified, reduced, and alkylated C2 fragments after incubation at 25 °C with H2O2 for 2 and 6 weeks. mAU, milliabsorbance unit. B, deconvoluted mass spectrum of peak 3 in A. C, deconvoluted mass spectrum of peak 4 in A. Each major peak was labeled with its mass and the corresponding single letter amino acid of the N-terminal residue.

