FIGURE 3.
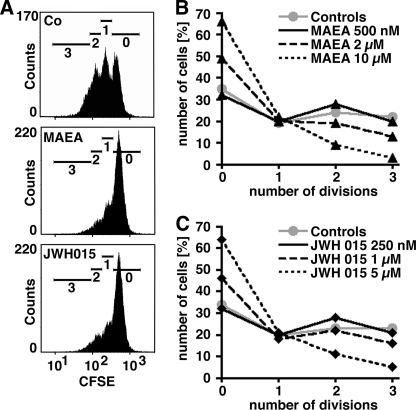
Effect of cannabinoids on T cell proliferation. IL-4-stimulated primary human T cells were loaded with CFSE and then left untreated (Co) or pretreated with a single dose of cannabinoids for 2 h prior to inoculation on anti-CD3/anti-CD28 coated dishes. Three days later, cell proliferation was determined by CFSE dilution measured by FACS analysis. Two independent experiments were performed. A, representative FACS profiles for control cells and cells treated with MAEA (10 μm) and JWH015 (5 μm). The bars with the numbers above the profiles indicate how many rounds of division these cells underwent. Note that the gate was set only on viable cells, although no increase in cell death after cannabinoid treatment was observed. B and C, inhibition of T cell proliferation at different concentrations of cannabinoids. The percentage of cells in each round of division for different concentrations of MAEA (B) and JWH015 (C) is depicted.

