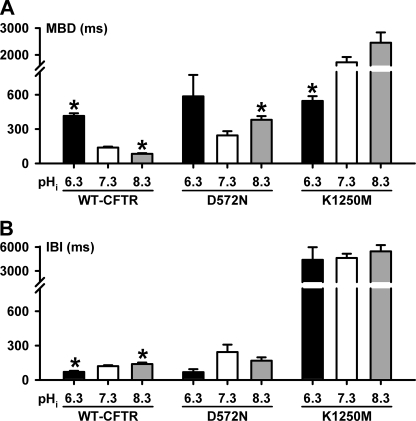
FIGURE 8.
Burst analysis of D572N- and K1250M-CFTR. A and B, MBD and IBI of D572N- and K1250M-CFTR at different pHi values; wild-type CFTR data are shown for comparison. Data are means ± S.E. (D572N- and K1250M-CFTR, n = 3; wild-type-CFTR, n ≥ 6). The asterisks indicate values that are significantly different from the pHi 7.3 control (p < 0.05). Note the breaks in the ordinates.

