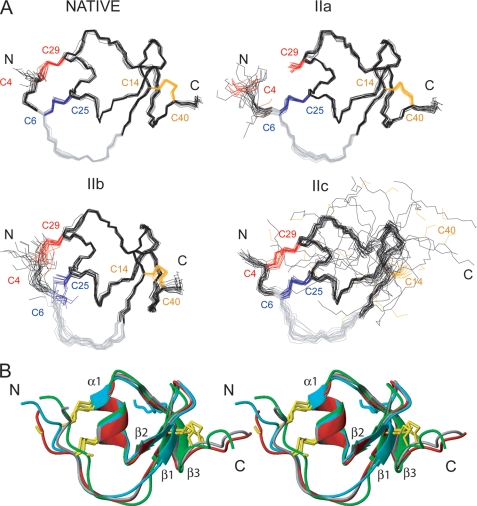
FIGURE 3.
NMR structures of the native and intermediate forms of LDTI. A, representation of 20 minimized structures of the native form and the folding intermediates IIa, IIb, and IIc. The cysteine residues of each protein are colored according to disulfide bonds: Cys4–Cys29 (red), Cys6-Cys25 (blue), and Cys14–Cys40 (orange). The canonical inhibitory loop comprising residues Cys6-Lys11 is colored in gray. The N- and C-terminal ends are labeled. B, comparison of the mean structure of native LDTI (gray), IIa (red), IIb (green), and IIc (blue) in a stereo-view ribbon representation. The secondary structure elements are labeled, and the cysteine residues are shown in yellow.

