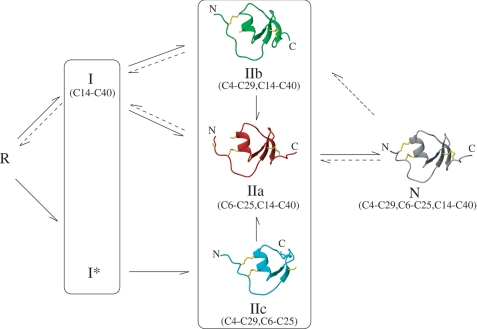
FIGURE 5.
Scheme of the oxidative folding and reductive unfolding of LDTI. Solid and dashed arrows outline the predominant pathways of oxidative folding and reductive unfolding of LDTI, respectively. R and N indicate the fully reduced/unfolded and native forms of the protein, respectively, and Ix and IIx intermediates with one or two disulfide bonds. The average NMR structures of IIa, IIb, IIc, and N are represented as ribbon plots with the corresponding disulfide pairings.

