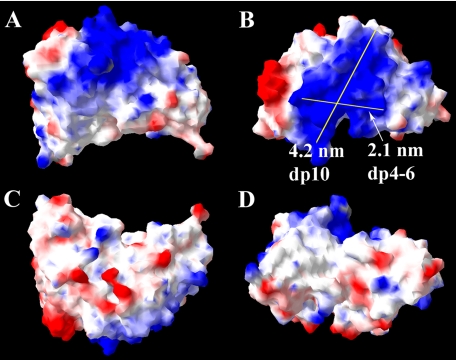
FIGURE 4.
Proposed model and surface electrostatic potential of HS3B7V from four perspectives. Two possible HS binding axes and their lengths are shown. Note the smaller proportion of basic residues and higher number of acidic patches on the surface of this antibody compared with the others (Compare with HS4E4V in Fig. 2 and other antibodies described in supplemental Figs. S1–S4). Regions of positive surface charge are represented in blue, and regions of negative charge are in red, whereas neutral areas are white.

