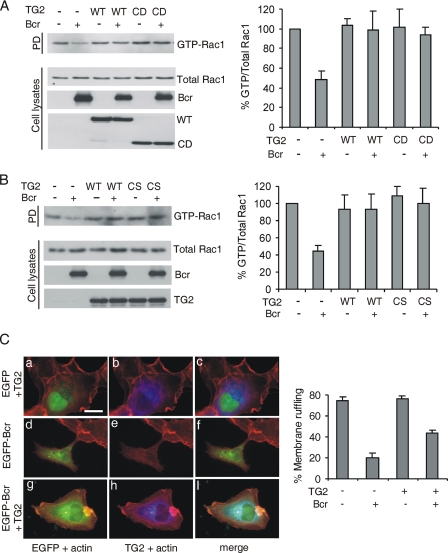
FIGURE 3.
TG2 blocks BcrGAP activity toward Rac1. A, left panel, after transfection of plasmids as indicated above the lanes, levels of endogenous active Rac1 were measured as described under “Experimental Procedures.” Expression levels of total Rac1, Bcr, or TG2 were determined with Rac1, Bcr (N-20), or Xpress antibodies. Right panel, the ratio of GTP-bound/total Rac1 compared with vector-expressing cells. Bars, mean ± S.D. of three independent experiments. B, left panel, levels of activated Rac after co-expression of Bcr and TG2 WT or CS. Total TG2 levels were measured using TG2 antibodies. Right panel, quantitation of results. C, left panel, cells transfected with the constructs indicated were serum-starved for 24 h and stimulated with EGF (100 ng/ml) for 10 min. TG2 or actin was visualized by immunofluorescence using TG2 antibodies (blue) or phalloidin (red). a, d, and g, EGFP and actin; b, e, and h, TG2 and actin; c, f, and i, merge. Scale bar, 30 μm. Right panel, quantitation of the number of transfected cells showing membrane ruffling of the total cell number. Error bars, standard deviation of duplicate coverslips. Results shown here represent one of three independent experiments.

