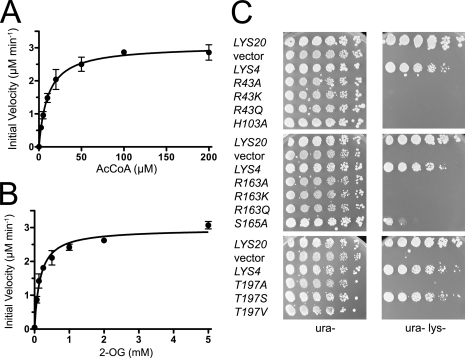
FIGURE 4.
In vitro and in vivo activity of SpHCS. A and B, shown are Michaelis-Menten plots of the initial velocity versus AcCoA concentration (A) and 2-OG concentration (B) for the formation of homocitrate catalyzed by WT SpHCS. Data points are the average of triplicate measurements, and the error bars represent 1 S.D. C, in vivo yeast growth assays of LYS4 and LYS4 2-OG binding mutants.

