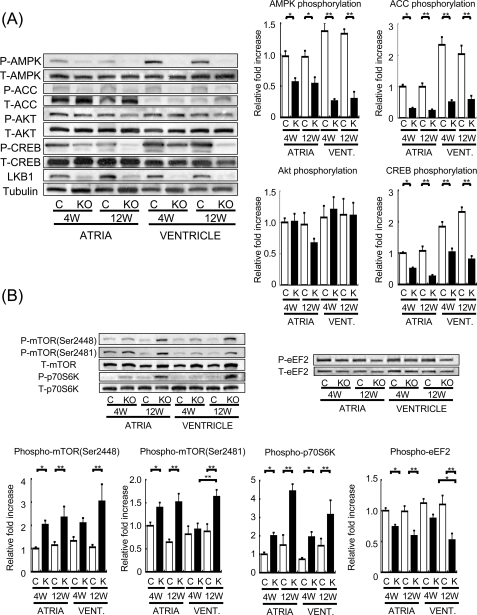
FIGURE 6.
Phosphorylation level of AMPK, ACC, CREB, and Akt in both atria and ventricles from control and LKB1-KO mice. A, left, representative blot of phosphorylated and total AMPK (pAMPK and tAMPK, respectively), phosphorylated and total ACC (pACC and tACC, respectively), phosphorylated and total Akt (pAKT and tAKT, respectively), and phosphorylated and total CREB (pCREB and tCREB, respectively). Right, results of densitometric analysis of ACC, AMPK, Akt, and CREB phosphorylation. B, phosphorylation level of mTOR, p70S6 kinase, and eEF2 in atria and ventricles from control and LKB1-KO mice. Upper, representative blot of phospho- and total mTOR, p70S6 kinase and eEF2. Lower, densitometric analysis of mTOR, p70S6 kinase, and eEF2 phosphorylation. The phosphorylation levels were quantified and are expressed as change relative to each control band (atria from control mice at 4 weeks of age). Values shown are mean ± S.E. *, p < 0.05; **, p < 0.01; n = 8 in each group.

