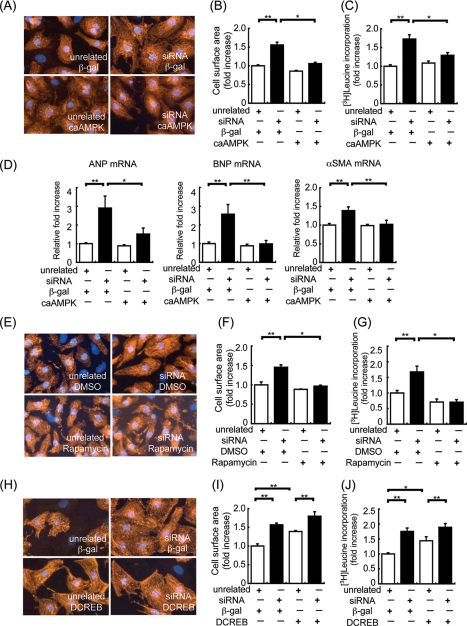
FIGURE 7.
Assessment of LKB1 siRNA-induced cardiac myocyte hypertrophy. LKB1 siRNA-induced cardiac myocyte hypertrophy was inhibited by caAMPK, not DCREB, in vitro. A, representative cell size of cardiac myocytes transfected with unrelated siRNA (control) or LKB1 siRNA for 48 h. After 24 h of siRNA transfection, cardiac myocytes were transfected with β-galactosidase (β-gal) or caAMPK adenovirus. Cardiac myocytes were stained with α-actinin for quantification of cell surface area. B, quantitative analysis of cell surface area after siRNA transfection with or without caAMPK adenovirus infection. *, p < 0.05; **, p < 0.01; n = 4 in each group. C, [3H]leucine incorporation for assessment of protein synthesis in cardiac myocytes. The measurement of radioactivity in cardiac myocytes after siRNA transfection with or without caAMPK adenovirus infection is shown. *, p < 0.05; **, p < 0.01; n = 8–12 in each group. D, results of real time PCR analysis of A-type natriuretic peptide (ANP), B-type natriuretic peptide (BNP), and α-smooth muscle actin (α-SMA), expression with control or siRNA in the presence of β-galactosidase or caAMPK adenovirus. *, p < 0.05; **, p < 0.01; n = 6 in each group. E, representative cell size of cardiac myocytes transfected with unrelated siRNA (control) or LKB1 siRNA for 48 h. After 24 h of siRNA transfection, cardiac myocytes were treated with vehicle (DMSO) or rapamycin. Cardiac myocytes were stained with α-actinin for quantification of cell surface area. n = 4 in each group. F, quantitative analysis of cell surface area after siRNA transfection with or without rapamycin treatment. *, p < 0.05; **, p < 0.01; n = 4 in each group. G, [3H]leucine incorporation for assessment of protein synthesis in cardiac myocytes. The measurement of radioactivity in cardiac myocytes after siRNA transfection with or without rapamycin treatment is shown. *, p < 0.05; **, p < 0.01; n = 6–8 in each group. H, representative cell size of cardiac myocytes transfected with unrelated siRNA (control) or LKB1 siRNA for 48 h. Cardiac myocytes were stained with α-actinin for quantification of cell surface area. n = 4 in each group. I, quantitative analysis of cell surface area after siRNA transfection with or without DCREB adenovirus infection. **, p < 0.01; n = 4 in each group. J, [3H]leucine incorporation for assessment of protein synthesis in cardiac myocytes. The measurement of radioactivity in cardiac myocytes after siRNA transfection with or without DCREB adenovirus infection is shown. *, p < 0.05; **, p < 0.01; n = 8–12 in each group. In all panels, values are expressed as mean ± S.E.

