Figure 1.
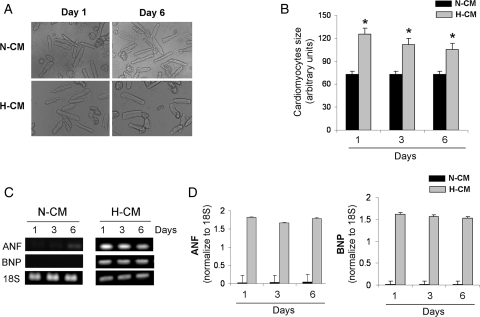
Adult rat N-CM and H-CM cultures and their stability. (A) Morphology of H-CMs and N-CMs at days 1 and 6. (B) Quantitative analysis of cardiomyocyte size at days 1 and 6. n = 6. *P < 0.05. (C) PCR analysis of hypertrophic markers, ANF and BNP, at days 1, 3, and 6 in H-CMs and N-CMs. 18S was used as an internal control. (D) Quantitative analysis of ANF (left panel) and BNP (right panel) at days 1, 3, and 6 in H-CMs and N-CMs. n = 6.

