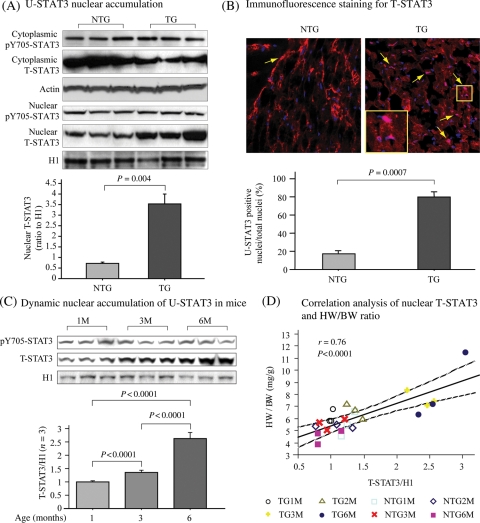
Figure 2.
Nuclear accumulation of U-STAT3 in TG mouse cardiac cells is associated with the development of cardiac hypertrophy. (A) Immunoblot analysis of STAT3 and pY705-STAT3 in the nuclear and cytoplasmic fractions from heart tissue. (B) Representative immunofluorescence staining of a heart tissue section, red indicated staining of T-STAT3, nuclei were stained with DAPI. Bar graph shows the ratio of T-STAT3 positive nuclei to the total nuclei in the same area. Arrows indicate representative T-STAT3 positive nuclei. The inset shows merge of red and blue yielding pink colour. (C) Age-dynamic change of nuclear STAT3 by immunoblotting assay. Histone H1 was re-blotted as a loading control. Bar graph shows statistical analysis of ratio of nuclear T-STAT3 to histone H1 (n = 3). (D) Correlation analysis between HW/BW and nuclear T-STAT3 expression. pY705-phosphorylated tyrosine 705; T-total; HW: heart weight; BW: body weight; M: months.

