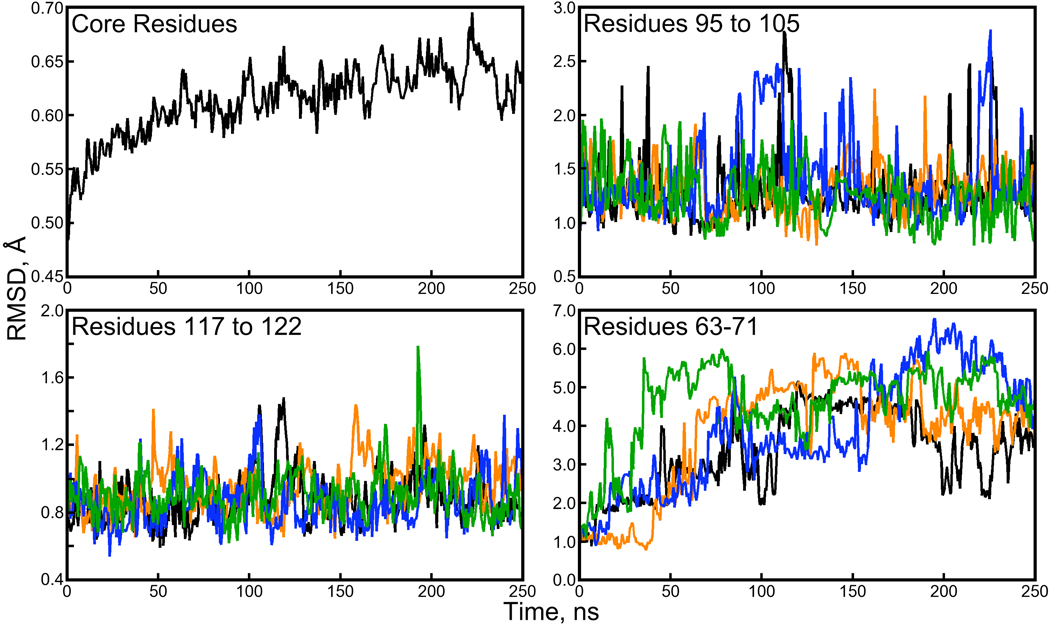
Figure 2. Backbone RMSD for subdomains of the streptavidin proteins.
A plot of the average backbone RMSD for “core residues” (a total of 67 within each monomer, illustrated in Figure 1 of the Supporting Information) shows much lower backbone RMSD than the monomers or tetramer as a whole. It is the loop regions of the protein, particularly residues 63 to 71, that depart the most from their crystallographic conformations. Plots of loop backbone RMSDs were generated by aligning the core residues of each snapshot with the 1MK5 structure and then computing RMSD for the subset of residues listed in each panel. The color scheme for three of the panels follows Figure 1.

