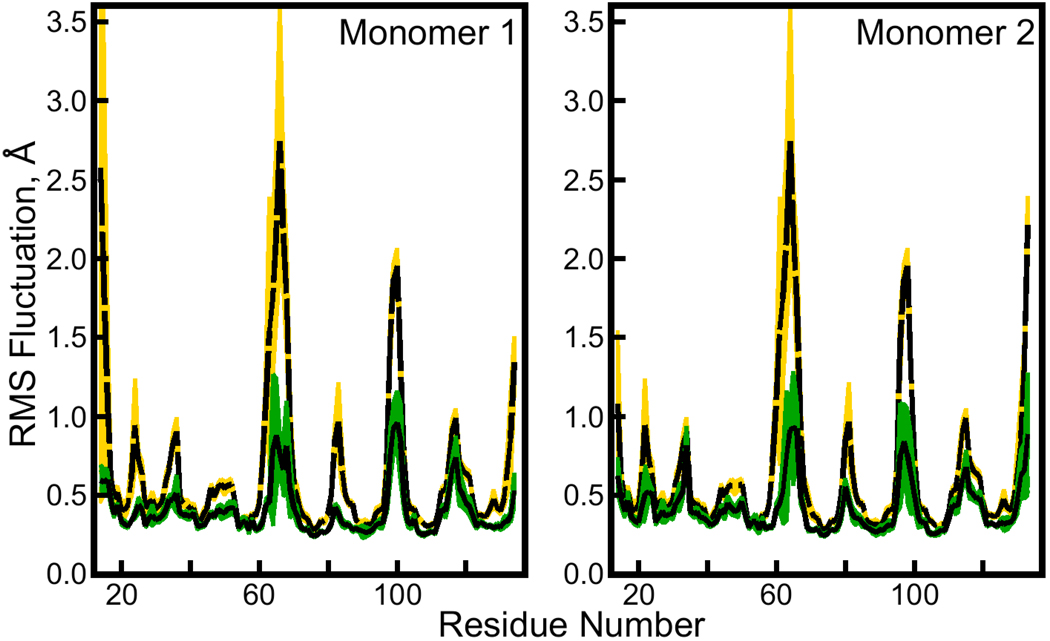
Figure 4. Atomic root mean squared (RMS) fluctuations for backbone Cα atoms in the solution-phase and cryo-solvated lattice simulations.
Atomic RMS fluctuations were computed by first making optimal alignments based on the positions of backbone atoms. The solution phase simulation contained four independent, symmetry-related streptavidin monomers, whereas the lattice simulation contained eight independent, symmetry-related asymmetric units (ASUs), each of them a streptavidin dimer. The black lines surrounded by green and the dashed black line surrounded by yellow show average atomic RMS fluctuations from the eight ASUs in the lattice simulation and four monomers in the solution phase simulation, respectively. The green and yellow regions themselves represent standard deviations in the atomic fluctuations computed for the ASUs or monomers. Fluctuations for each of the two monomers (“Monomer 1” and “Monomer 2”) in the lattice simulation ASU are plotted separately; the fluctuations of all monomers from the solution-phase simulation are given in both parts of the figure.

