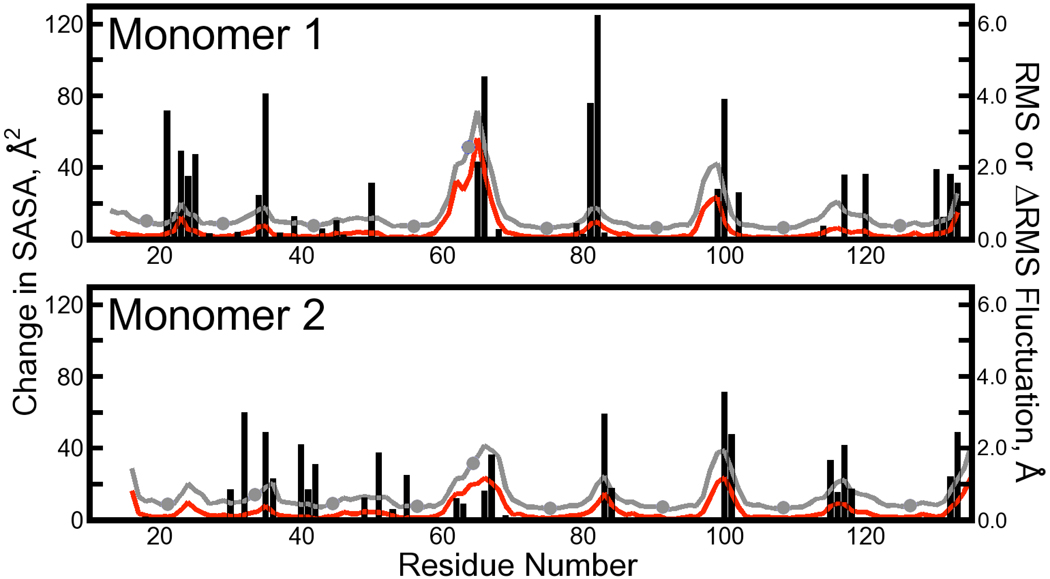
Figure 5. Juxtaposition of changes in atomic fluctuations with increases in residue solvent-accessible surface area (SASA).
Atomic fluctuations, plotted as gray lines with filled circles, were computed for backbone Cα atoms from the solution phase trajectory data as in Figure 4. Differences in the magnitudes of these fluctuations and those collected from the cryo-solvated lattice simulation are plotted as red lines. Changes in SASA resulting from taking the streptavidin tetramer out of the lattice and into solution are superimposed as black bars.

