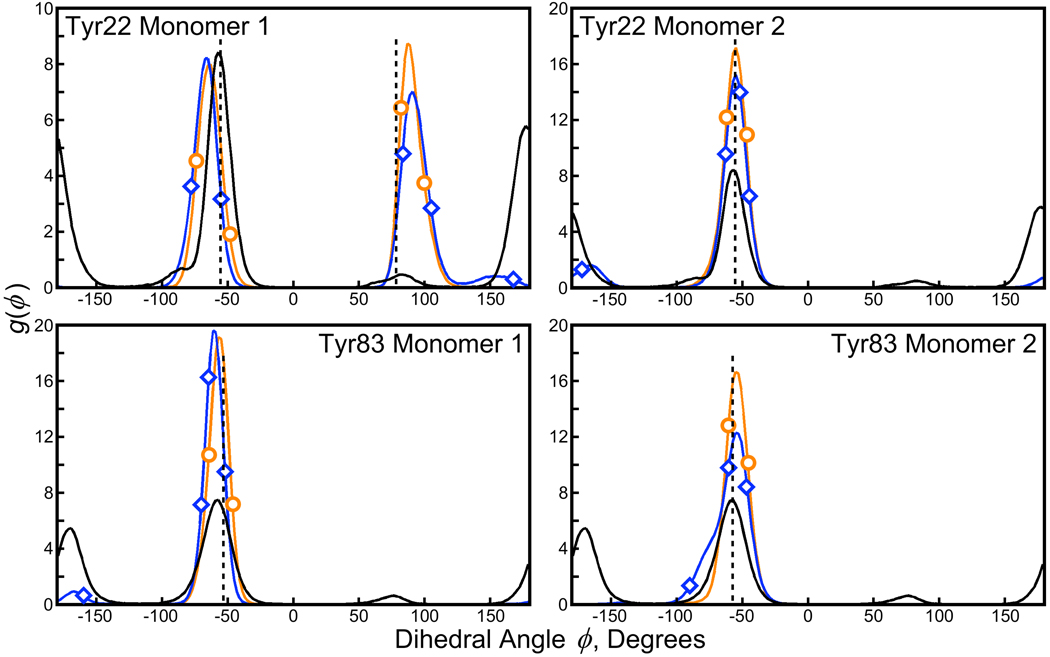
Figure 6. χ1 distributions for tyrosine residues making lattice contacts in the 1MK5 structure.
Experimental values of χ1 are given by the black dashed vertical lines in each panel; distributions of χ1 observed in the cryo-solvated and water-solvated lattice simulations are given by the orange line marked with circles and the blue line marked with diamonds, respectively; distributions from the solution-phase simulation are given by the solid black line. Distributions from each lattice represent averages over eight symmetry-related monomers, and each of two monomers in the asymmetric unit are distinguished on the right and left halves of the figure. Distributions in the solution phase represent averages over all four monomers of each simulation (note that the y-axis scale for the top left panel differs from the other three panels). New conformational states of each tyrosine are found in solution; similar states begin to become populated in the lattice phase if the crystallization conditions are approximated with pure water. Figure 7 shows results for seven streptavidin crystals isomorphous with 1MK5, but we observed no diversity among the crystallographic χ1 values for these tyrosine residues.

