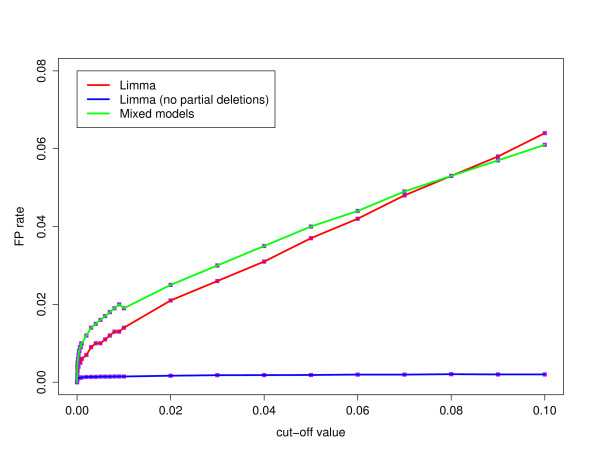
Figure 4.
False positive rate. For the mixed model and the linear model, the false positive (FP) rates are plotted for the range of significance levels α with a green and red line, respectively. The FP rate for the complete deletions or duplications, obtained via the linear model is indicated in blue.

