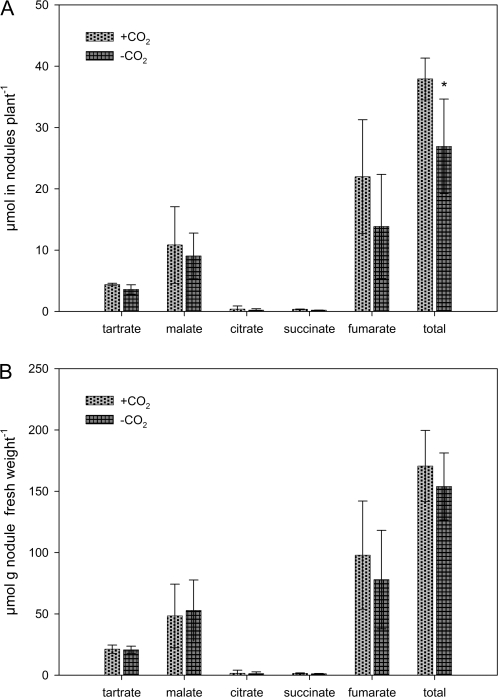
Fig. 6.
Nodule organic acid compostition. Data are the means of four replicates. Bars represent standard deviation. An asterisk indicates a statistically significant difference from the +CO2 treatment (t test, P ≤0.05). (A) Total amount of organic acids in nodules per plant. (B) Concentration of detected organic acids in nodules.

