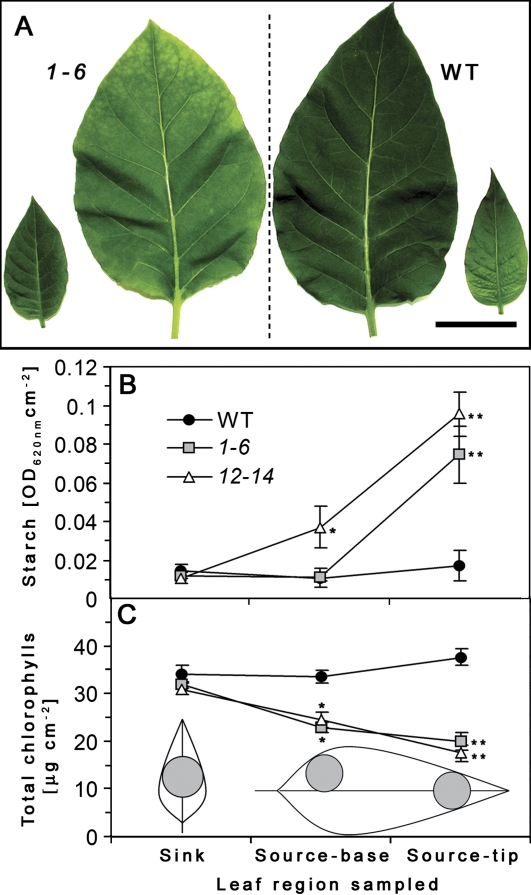
Fig. 5.
Leaf starch (B) and chlorophyll content (C) of AtRGP2:GFP and WT tobacco. (A) Sink leaf (9th or 10th from the base) and source leaf (5th or 6th from the base) of transgenic line 1-6 (left) and of WT (right). Leaf tissue was sampled from leaf discs as shown in (C). Leaf starch content was determined from leaf tissue homogenate stained with I/KI. Total leaf chlorophyll content was determined by the absorption of chlorophyll pigments extracted by DMF. Values represent means ±SE of a pool of comparable leaves of five individual plants from each line (B, n=10–15; C, n=7–12). Asterisks in (B) and (C) indicate statistical differences at P <0.0001 as determined by Student's t test. Bar=5 cm (A). (This figure is available in colour at JXB online.)

