Fig. 6.
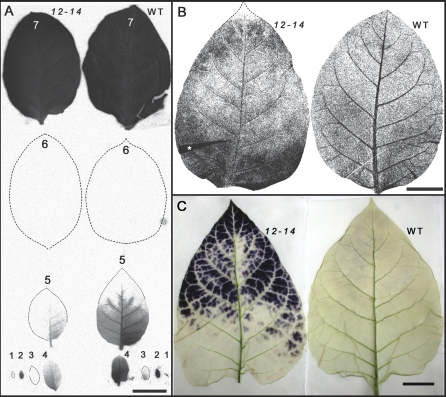
14C distribution pattern after 30 min 14CO2 pulse labelling, and starch accumulation pattern in AtRGP2:GFP (line 12-14) and WT tobacco leaves. (A) Autoradiograph of labelled fully expanded source (no. 7) and importing (no. 1 to no. 5) leaves of young transgenic and WT plants (both having 9–10 leaves) after 1 h chase. Sink leaves of transgenic plant import less [14C]-photosynthate than corresponding WT leaves after the 1 h translocation period, although the pattern of radioactivity distribution is similar. Lower leaves (nos 8–10) did not accumulate detectable radioactivity after 1 h chase time (not shown). (B) Autoradiograph of 14CO2 labelled fully expanded source leaves (7th from the tip) of more mature plants (13–14 leaves) after 30 h chase. The radioactivity in the WT leaf is mostly concentrated in major veins, while the transgenic leaf has higher radioactivity in interveinal (mesophyll) areas especially at the tip and the base. (C) Starch accumulation pattern in WT and chlorotic transgenic, fully expanded source leaf. After 5 h washing of I/KI-stained leaves large amounts of starch remain at the leaf tip region of transgenic plant, while almost no starch is detectable in WT leaf. (A, B) Representative pictures of two (A) and three (B) independent experiments each with three WT and three transgenic plants. Leaf fold area in (B) is marked by an asterisk. Bar=3 cm (A, B, C). (This figure is available in colour at JXB online.)

