Fig. 7.
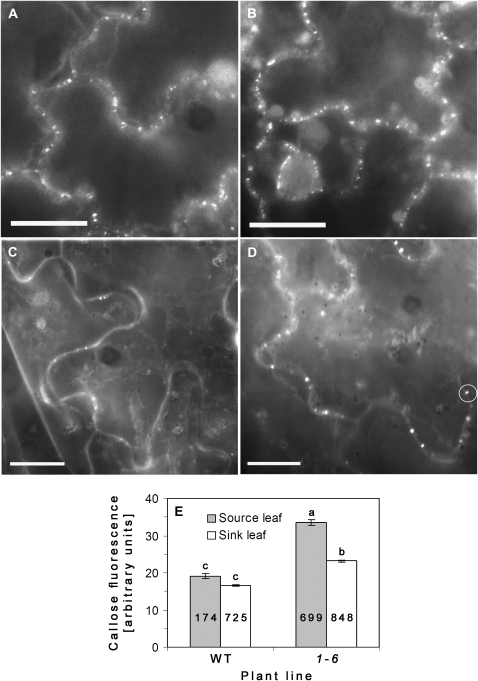
Basal callose levels in source (5th or 6th from the base) and sink (9th or 10th from the base) leaves of AtRGP2:GFP transgenic and WT plants. (A–D) Fluorescent micrographs of aniline blue-stained leaf epidermal cells of WT sink (A), transgenic sink (B), WT source (C), and transgenic source (D) leaves. (E) Fluorescence intensity (arbitrary units) of callose deposits, measured from randomly chosen cells, determined by subtracting background intensity from the maximal intensity value within a defined area enclosing Pd foci (white circle in D). Note: in WT source leaves much fewer Pd are stained with aniline blue than in transgenic leaves. Values in (E) represent means ±SE of Pd callose intensity of three leaves taken from two individual plants of each line. Lowercase letters indicate statistical differences at P <0.05 as determined by the Tukey–Kramer HSD test. Numbers within columns indicate the number of fluorescent foci examined (n). Bar=20 μm (A–D).

